 Joel Venn, head analyst at Regen highlights the importance of granular level modelling in creating a fairer and more decarbonised future
While there has been a lot of focus and analysis about how the shift to renewable energy will impact the overall energy system and energy system balancing, perhaps the greater network challenge is to understand how the mass uptake of consumer led low carbon technologies (LCTs) such as electric vehicles, heat pumps and other forms of electric heating will impact on the low voltage network. Will the distribution substation transformers that we see attached to telegraph poles in our neighbourhoods, and the feeder cables that run down our streets, that deliver electricity directly to our homes and businesses be able to cope when the majority of vehicles are electric and when electricity is widely used for heating?
Correction: perhaps the question is not so much “will they be able to cope?” but rather, at what stage will they need to be upgraded and how can this be planned and financed in the most efficient way to meet society’s demand for new energy uses and to optimise network investment? This is not a trivial question, shifting energy for transport and heating to the electricity network is bound to require additional investment, by some estimates this could amount to tens of billions of pounds[1] by 2050.
Getting this investment right, making the right investment at the right time (as well as using non-network flexibility solutions) is not just about saving money and achieving synergies from economies of scale and coordination, it is also about making sure that communities and individual consumers are not left behind in what could otherwise become a postcode lottery for access to energy.
Regen’s high granularity LCT uptake modelling is seeking to understand how LCT uptake could impact low voltage electricity networks. Building on the scenarios work Regen has undertaken for Southern Electricity Networks (SSEN) and other DNOs, SSEN commissioned Regen to deliver scenario-based projections for the uptake of EVs, EV chargers, heat pumps and rooftop PV. This analysis has been undertaken down the individual LV feeders in both of SSEN’s licence areas, equivalent to street-level projections.
The intention of the modelling is not to try to pinpoint exactly which houses and building will have a heat pump or an EV charger. It would be a pretty clever model if it could predict that the occupier at 221b Baker St will buy an electric car in 2034. Instead it tries to give the networks a granular representation of the spread and rate of deployment of low carbon technology under a number of scenarios which can then be used to understand their impact, including the levels of uncertainty and risk. SSEN will use these projections to enable detailed investment planning and risk mitigation strategies, and to provide an evidence base to support the development of SSEN’s RIIO-ED2 price control period business case.
The report presents the results of these scenario-based projections and accompanies the detailed database and summary analysis.
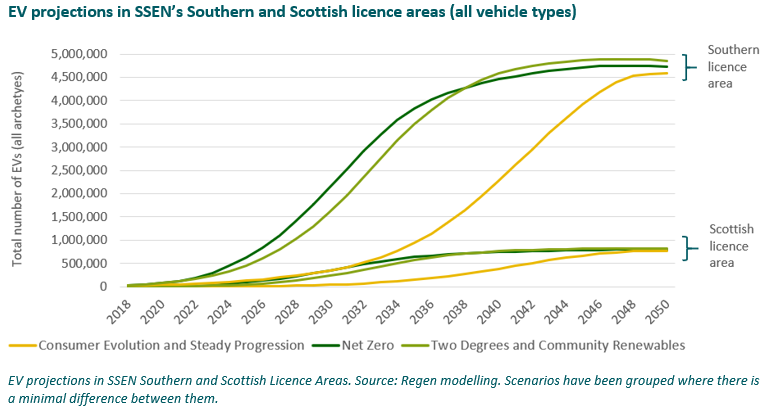
It presents the summary projections for the installation of approximately 270,000 non-domestic and 1.6 million domestic EV chargers in the SSEN Southern licence area in a Net Zero scenario in 2050, serving 4.5 million EVs. In addition to the 50,000 non-domestic and 382,000 domestic EV chargers in the SSEN Scottish licence area in a Net Zero scenario in 2050 to serve 600,000 EVs.
The report discusses insights that where explored in our analysis of the projections, including:
Example insights – Fair access to electric vehicle charging for all
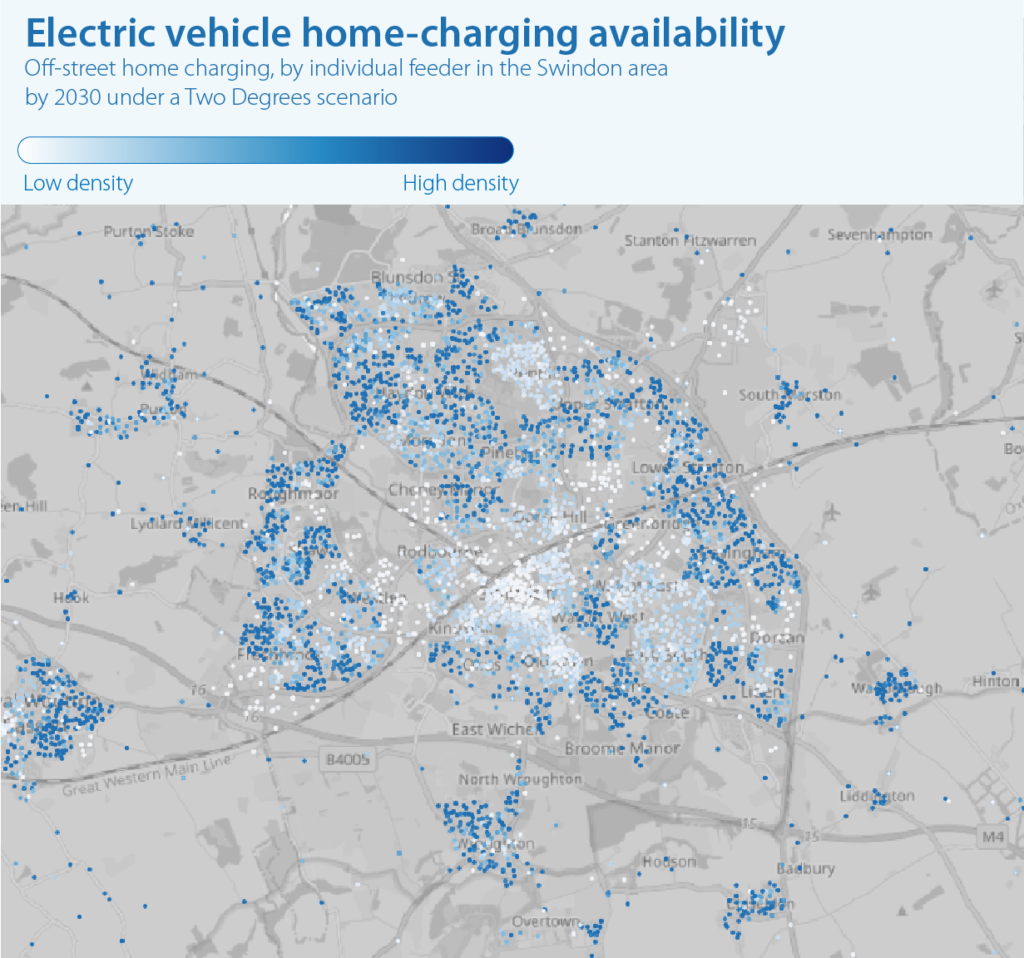
For example, we investigated the risk that if affluence is given too much significance as a driver for EV uptake, network investment will be channelled to more affluent areas and will create inequitable access to EVs in the future. This is particularly true for public charging, having confirmed previous suspicions that there is a greater need for public charging locations in less affluent areas.
This is due to the availability of on and off-street parking which is closely associated with lower and higher levels of affluence. Particularly in towns and cities, there are large areas with little off-street parking availability. As a result, these areas will need more near home public charging in order to provide fairer access to EVs.
Example insights – Existing charging infrastructure reflects regional priorities
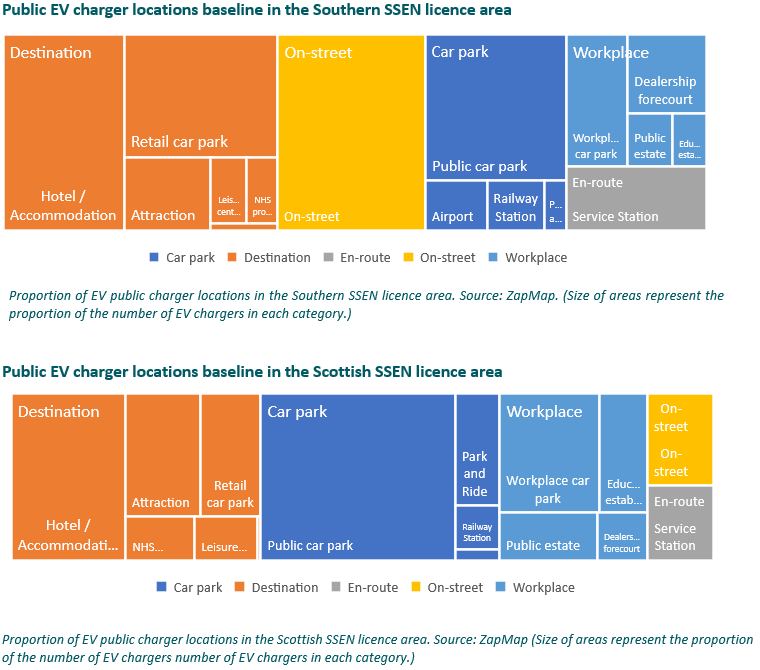
It was interesting analysing the baseline of existing EV chargers in SSEN’s licence areas. In their Scottish licence area, around three quarters of EV chargers are operated by ChargePlace Scotland, which is a national grant funded network of chargers developed by the Scottish government. This has resulted in a more centralised approach to EV charging there.
However, in the Southern licence area the majority of charging infrastructure is operated by private ventures which has resulted in a more decentralised approach to EV charging when compared to the Scottish licence area.
Example insights – Net Zero requires earlier infrastructure investment
An interesting area of analysis was building a net zero EV scenario. This included identifying what the impact to charging infrastructure could be by reducing gross vehicle miles or the total number of vehicles. The bespoke Net Zero scenario has a need for less charging infrastructure than other scenarios in the long term as a result of those factors, but it does need that infrastructure quicker than other less ambitious scenarios resulting in greater uptake in the near term.
Conclusion
Disaggregating LCT projections to over half a million feeders distribution substations presented a major challenge, both in terms of data processing and analysis. Once these feeders and distribution substations are combined with the other core variables of multiple technologies and sub-technologies, three decades of annual projections and five scenarios, approximately one billion individual projection values were successfully calculated for the study.
To find out more:
The results and insights from this work will be discussed on a webinar on the 13 July. SSEN and Regen will present the methodology and key learnings from the work with time for Q&A from participants.
SSEN also intends to make available the detailed datasets for use by academics, local authorities and other organisations to conduct their own analysis and modelling.
[1] See for example Capital Economics Zero Carbon Communities Report estimate of £48.5 billion network investment by 2050. www.spenergynetworks.co.uk/userfiles/file/Zero_Carbon_Communities_Report.pdf?v=3