Next in our Race To Zero series: Mark Howard, Regen’s project manager and Sustainability Task Force lead, provides an update on our efforts to measure and report our greenhouse gas emissions.

This is the third in our ongoing series of blogs documenting Regen’s internal work to become net zero by 2030. Our first which provides some background on this work and the race to zero can be found here, our second which covers the nebulous topic of ‘green tariffs’ can be found here. In this blog I provide an update of our efforts to voluntarily measure and report our greenhouse gas emissions, which we are doing with the aim of informing our approach to net zero and tracking our progress.
Summary
In line with our net zero commitment under the SME Climate Hub, we have recently published reports for the years 2019 and 2020, full details of which can be found here. The assessment for 2020 shows a significant change in gross emissions, reducing to 54% of the 2019 baseline (shown in the following chart), this unusual time has given us insight into how rapidly some parts of our operations can change. In this blog I highlight some of the interesting findings that came up as part of the recent emissions assessment process.
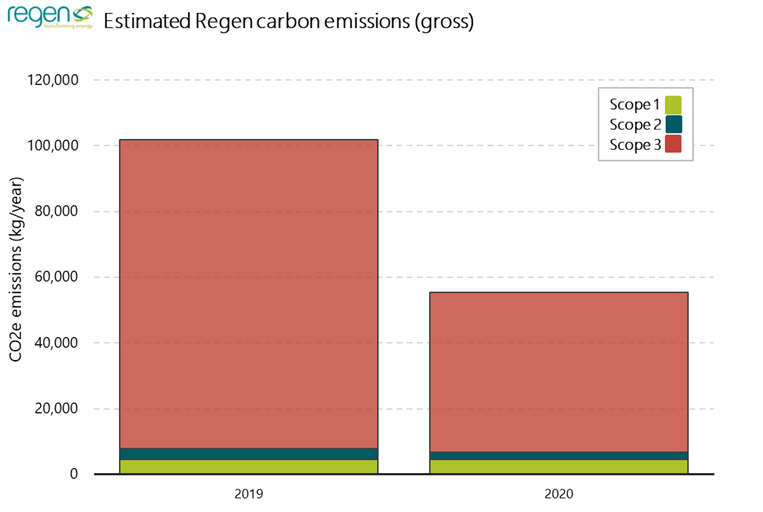
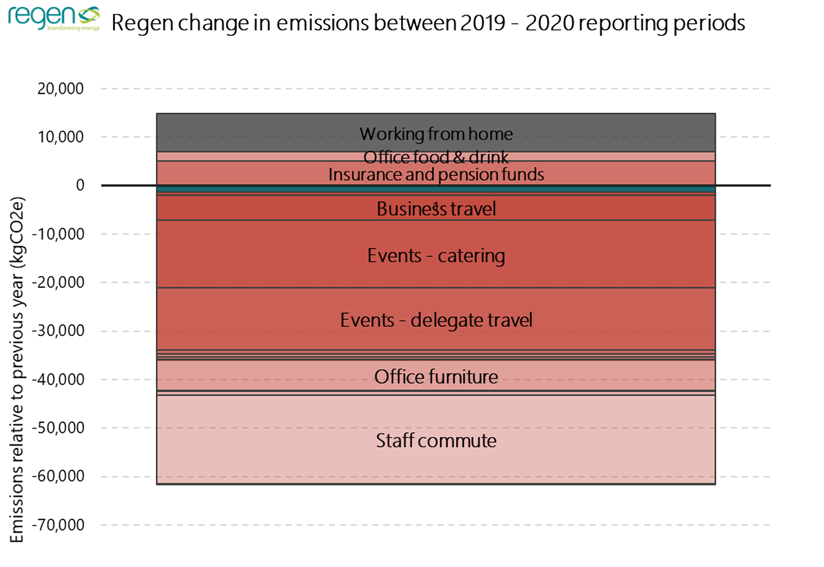
The assessment for 2020 shows a significant change in emissions, reducing to 54% of the 2019 baseline. This reduction is largely due to reduced staff commute and delegate travel to events and would be expected to rebound to a certain extent in 2021 and future years.
Electricity emissions were lower in 2020, due to a ~30% reduction in consumption caused by a lack of office occupation, combined with a reduction in the emissions intensity of the national grid.
The importance of verifying data
Our previous 2019 greenhouse gas assessment was produced as a first attempt at understanding Regen’s carbon footprint, with various projections and assumptions made. It gave us a good steer on where to focus our early discussions about managing our impacts, but we wanted to revisit and check its accuracy as since that time we have developed our strategic approach to managing our emissions, as well as adopting climate targets and reporting into policy. The two versions of the assessment are shown in the following chart, highlighting that importantly the revised overall emissions levels are very similar to the first assessment. The improved accuracy has given us greater confidence, but not caused us to significantly shift focus.
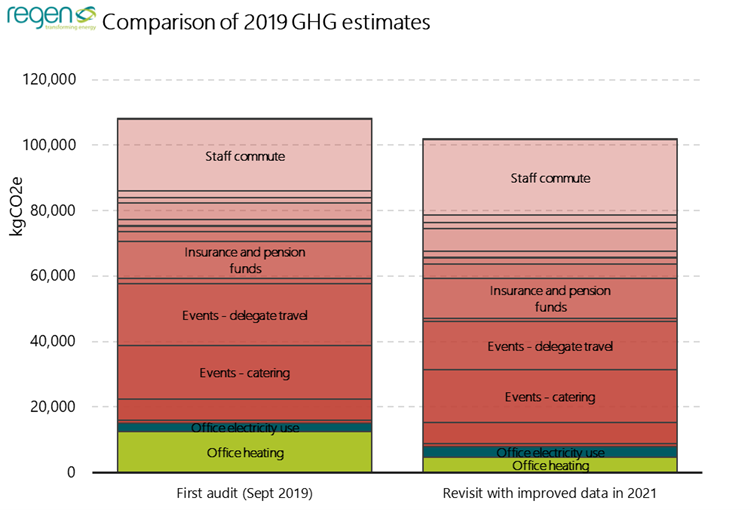
Revisiting our assessment was useful in highlighting the importance of tracking assumptions and verifying data, even for a relatively self-contained organisation like Regen it is easy to lose track. Notable changes are:
- Gas use in the office is lower, due to inaccurate data about metering from the first assessment.
- The impact of events is lower, due to a revised and more accurate approach to estimating these.
- Electricity use is slightly higher, as electricity used in communal office areas has been found to be metered separately and was not previously accounted for.
Tracking progress vs spending all our time counting carbon
A challenge with setting a broad boundary to include emissions such as ‘working from home’ and ‘pension funds’ is that the further away you go from actual metered energy use, the harder it is to gather good data and you necessarily use industry averages. A reasonably accurate estimate of emissions can be produced by this approach and used to highlight how significant a source of emissions might be, however it is difficult to move forwards and track the impact of changes you make to reduce these, without better data. For example, an estimate of emissions caused by the food and drink we provide at events is fine for the purposes of prioritising sources of emissions, it allows us to flag that this is an issue. How do we report on this next year, having decided that we will only provide meat-free catering as in general the evidence suggests this would reduce emissions by 1/3 to 1/2? Unless our caterers all start to report emissions (which we will be encouraging them to do, but cannot guarantee that they will yet) this could be difficult.
That being said, I am pragmatic about the process of tracking emissions in that it should provide an indication of where we need to go, and if we’re headed there, rather than an exact roadmap with each kg reduction tracked.
Regen staff commute survey, spring 2021
As part of our net zero work we ran a staff commute survey in spring 2021. The intention was to gather data for the 2020 carbon assessment, which will be reported separately, and to understand what policies Regen could put into place to help staff commute in a low carbon way (I’ll cover our action plans in the next blog).
Not all staff work full time, and in 2020, days spent in the office were very different from previous years, with a 75% reduction in travel emissions compared to 2019. The chart below accounts for total journeys made into the office by staff in 2020.
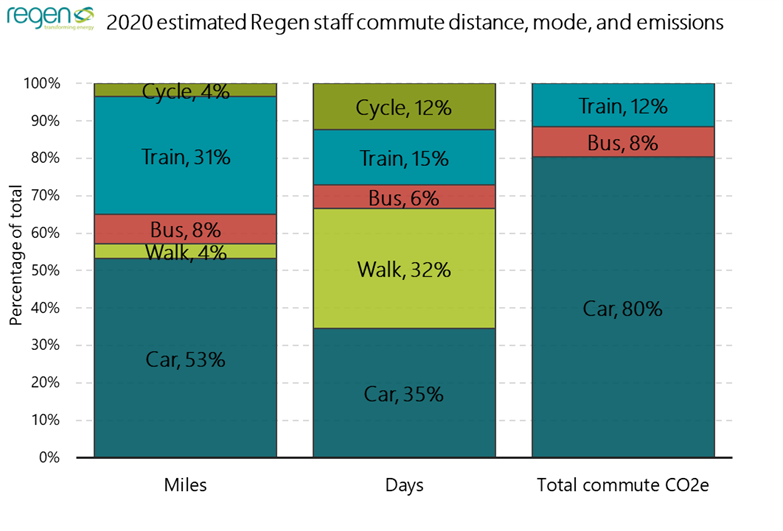
According to the national travel survey conducted by the ONS, in 2019 (the latest data) 61% of commuting trips were made by car and 12% walking – so Regen staff are much below average for private car commuting and much above average for walking.
Despite the reduction in travel, from a sustainability perspective the results present the same theme as previously – commute emissions are predominantly due to use of private cars and as such efforts should be focussed on helping staff reduce these emissions by switching all or part of their commute to a lower carbon mode.
Doing less without doing less
Clearly 2020 was an exceptional year, with 2021 so far only slightly closer to ‘normality’. These times have brought some significant changes for all industries, for Regen this has meant home working for us all and our schedule of events being shifted from conference centres to virtual rooms.
Where we have travelled less, we have heated our homes more. We have made an effort to account for this change by estimating our working from home emissions, following a methodology which can be found here. The result is a broad estimate, based on typical gas consumption data and the number of FTE hours worked.
For 2020, the increased working from home emissions nearly counteract reductions brought about by lower staff commute. This of course brings about the question as to whether it is lower carbon to work from home, or commute to the office.
Using these estimates, it is possible to suggest that generally commuting further than 10 miles each way by an average private car would generate higher emissions than heating a typical home with gas and powering a computer from home, during the heating season.
This notional threshold increases if a home is heated by oil or LPG, and increases significantly if commuting by rail or EV, to 37 miles and 33 miles respectively. For Regen only 10 members of staff live within a 10 mile commute, 24 within a 37 mile commute.
These distances are much reduced in summer due to the lack of heating required.
So, to minimise emissions it could be argued that those who live more than 10 miles from the office should commute by rail or EV, or work from home, but…
With carbon accounting it is important to avoid being entirely reductionist; we could significantly cut our carbon by doing nothing, but this ignores the wider value of the activity. Much of the time, a shared office has value beyond being a suitable place to work as it allows easy interaction and collaboration with colleagues in a way still not quite replaced by online communication. I can certainly see myself continuing to work from home when I need undisturbed focus time, coming into the office for meetings and more collaborative working.